RIDA Operations Sustainability Impact Report
Jan 2013 to July 2025
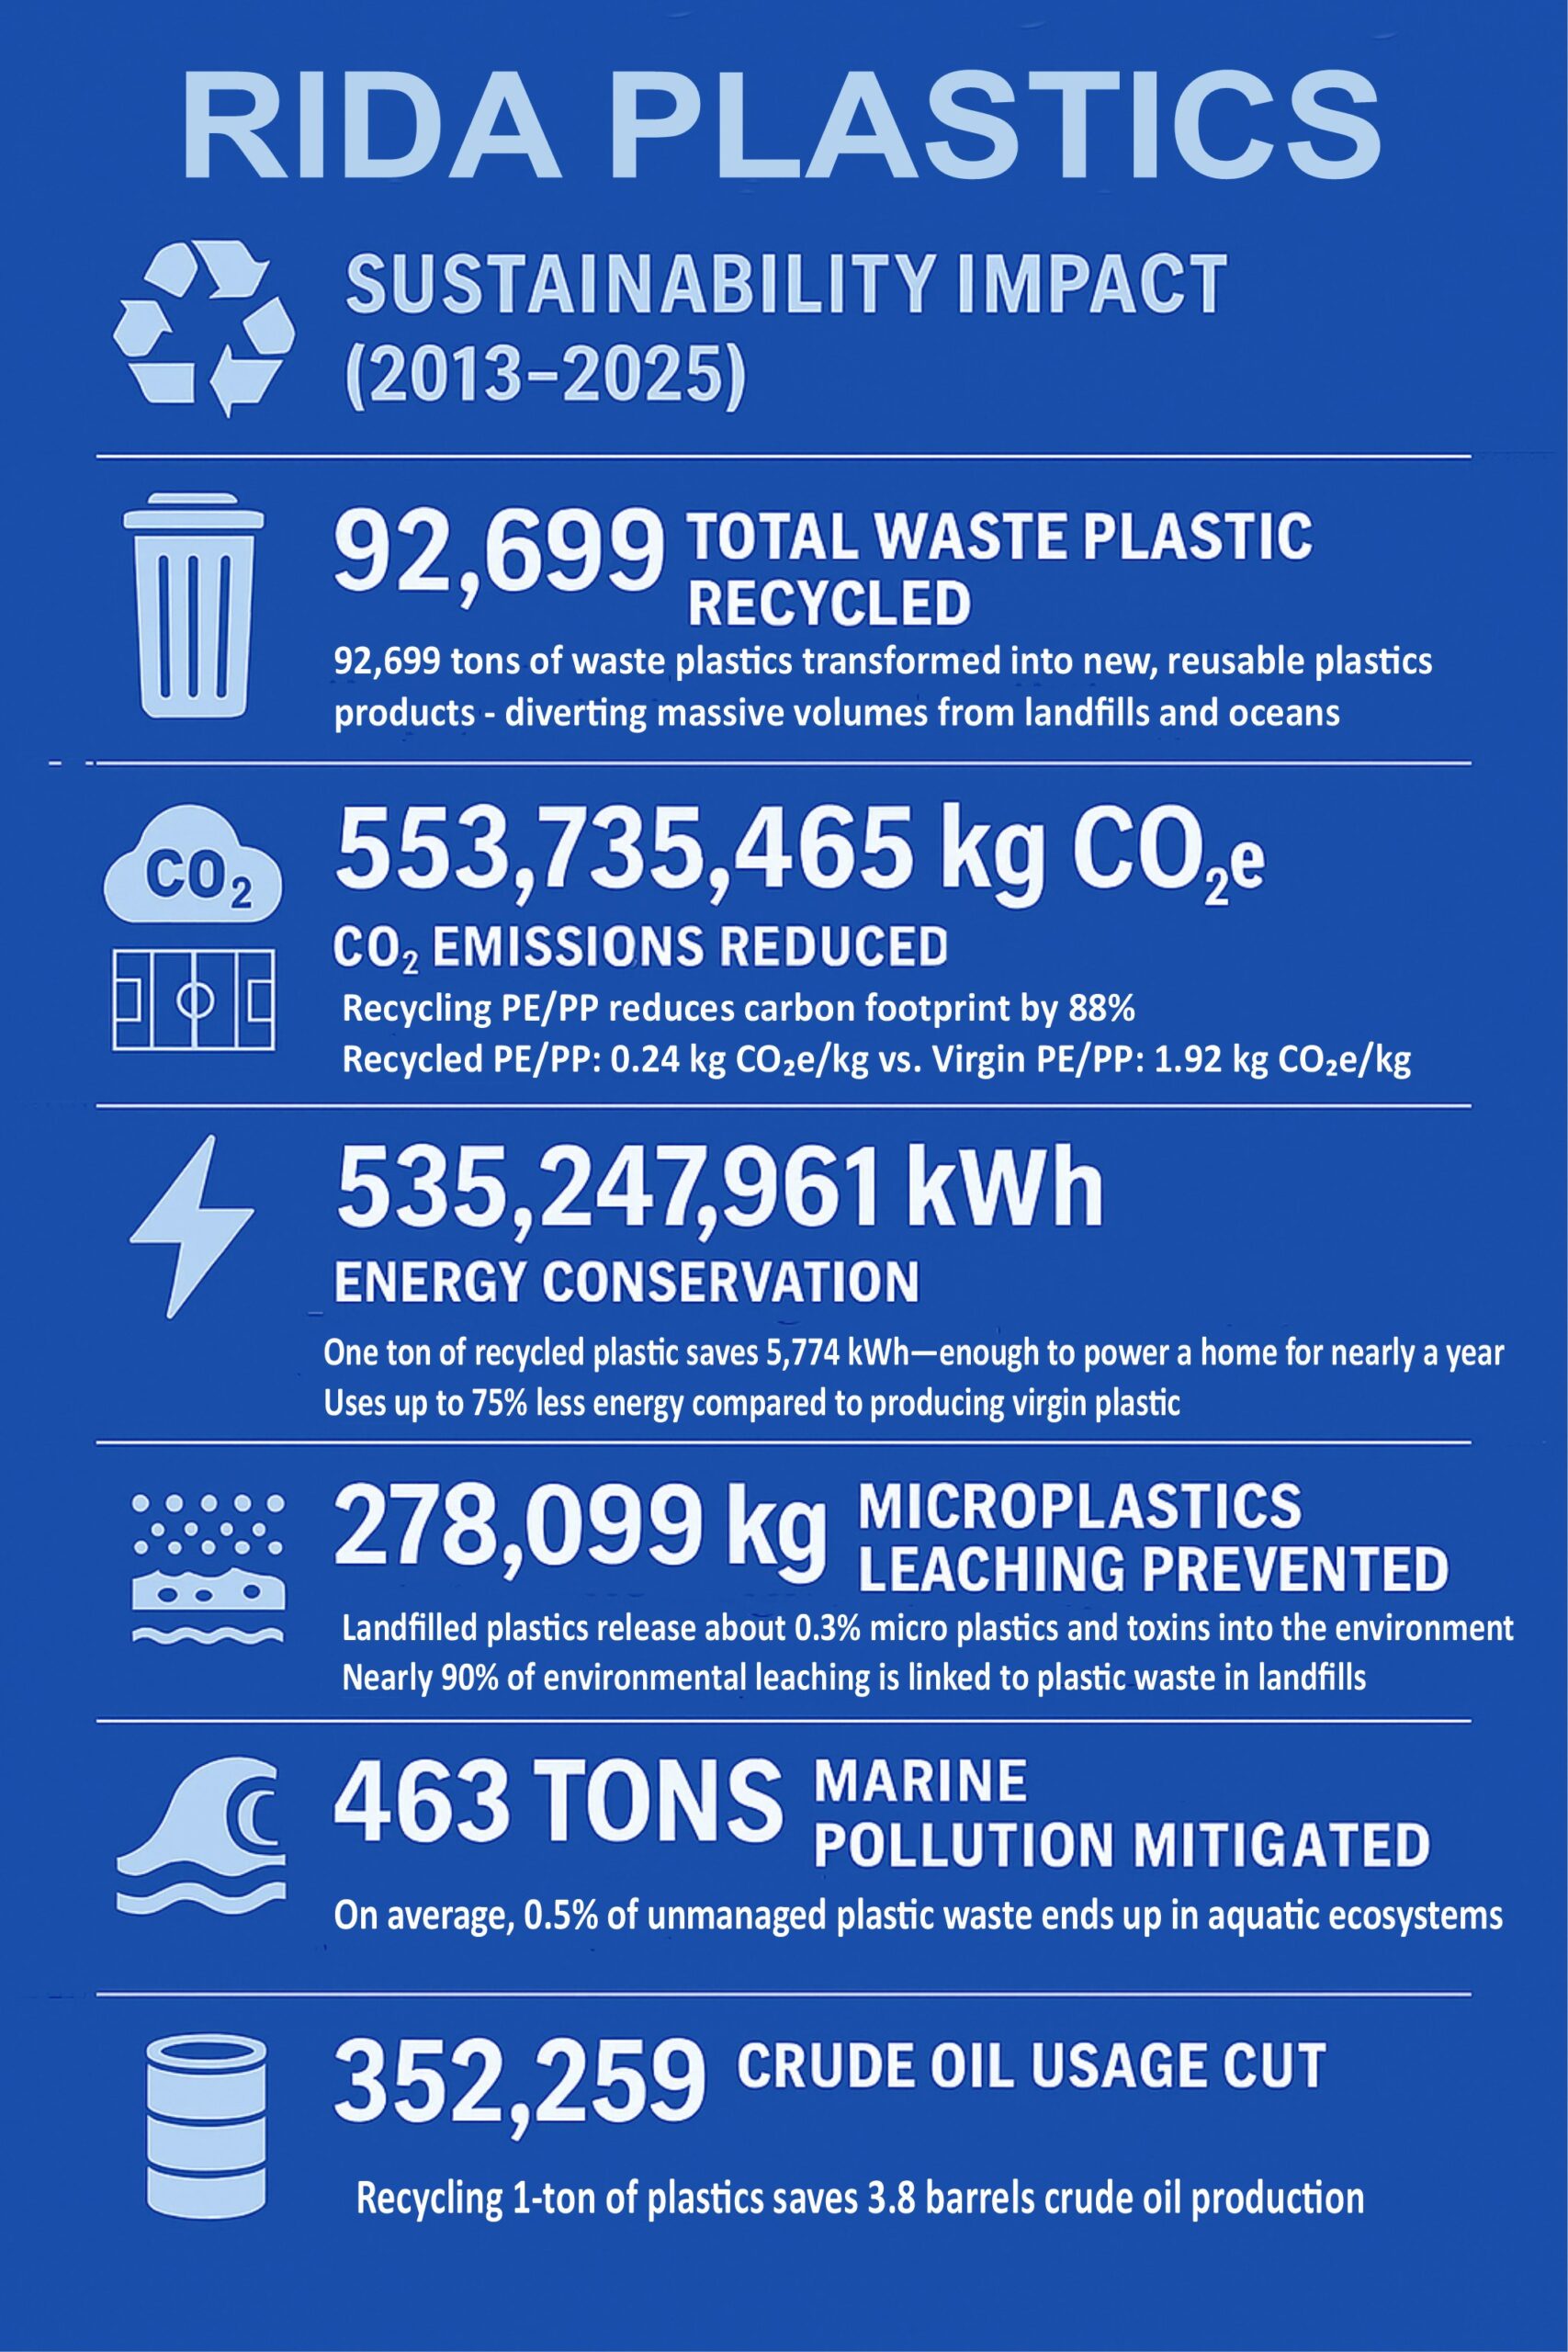
92,699 tons Total Waste Plastic Recycled and Transformed into new reusable plastic homeware products
528,388 m2 LAND FILL SPACE SAVINGS
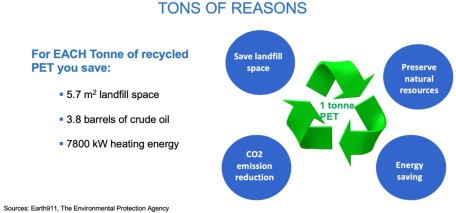
Every ton of recycled plastic saves 5.7 square meters of landfill space. You could fit approximately 64 football pitches into 528,388 m², as per FIFA dimensional regulations of 10,800 m² (120m x 90m).
155,735,465 e/Kg CO2 EMMISIONS SAVINGS
Recycling PE/PP saves a significant amount of CO2, with one study showing an 88% reduction in carbon footprint compared to virgin material, resulting in a footprint of 0.24 kg CO2e/kg for recycled PE/PP versus 1.92 kg CO2e/kg for virgin PE/PP.
535,247,961 kW ENERGY SAVINGS
Recycling plastic significantly reduces energy consumption because creating products from recycled materials uses substantially less energy than making them from virgin (new) raw materials. For instance, one ton of recycled plastic can save around 5,774 kWh of electricity, enough energy to power a home for nearly a year and can cut energy usage by as much as 75% compared to using virgin plastic. This energy saving is crucial, as it also reduces greenhouse gas emissions, conserves oil, and supports a more sustainable, circular economy.
278,099 Kg REDUCTION OF MICROPLASTICS LEACHING INTO ENVIRONMENT
Environmental Protection agencies declare waste plastics in the landfills leaches 0.3% of microplastics and toxins into the eco systems soil and water table (with 90% of all leaching being from waste plastics in the landfills), polluting the water table and reducing soil effectivity.
463 Tons WASTE PLASTIC REDUCTION INTO OCEANS & WATER WAYS
Environmental Protection agencies declare average of 0.5% of waste plastics seep into the world’s Oceans and Water Ways.
352,259 BARRELS CRUDE OIL PRODUCTION REDUCTION
Recycling 1-ton of plastics saves 3.8 barrels crude oil production.
Yearly Impact Summary
| Year | Qty’s (kg) |
|---|---|
| 2013 | 3,898,985 |
| 2014 | 5,717,272 |
| 2015 | 8,275,882 |
| 2016 | 8,518,872 |
| 2017 | 7,610,611 |
| 2018 | 7,332,387 |
| 2019 | 7,483,439 |
| 2020 | 7,551,932 |
| 2021 | 7,568,874 |
| 2022 | 7,647,829 |
| 2023 | 7,466,747 |
| 2024 | 8,675,007 |
| 2025 | 4,951,844 |
| Total | 92,699,682 |
2025 Average KG Price: ₦860
Estimated Value at Today’s Rate: ₦79,721,726,159
Sustainability Factors
| Factor | Amount | Metric | Impact |
|---|---|---|---|
| CO₂ / kg savings | 1.68 | kg e/kg | 155,735,465 |
| Landfill space savings | 5.7 | m² | 53,688 |
| Crude oil reduction dependence | 3.8 | Barrels | 352,250 |
| Energy savings | 5774 | kWh | 535,247,961 |
| Leaching reduction into ecosystem | 0.30% | Kg | 278,099 |
| Plastic reduction into oceans | 0.5% | Tons | 463 |
Job Creation
As we run a closed loop operation emanating from 100% Waste Plastics, the entire employment base of the various segments of the company are jobs created within a sustainable closed loop waste plastic recycling operation.
| Segment | Number of Employees |
|---|---|
| Waste Plastics Collection (Suppliers Staff Estimates) | 2300 |
| Waste Plastics Collection (Rida staff) | 107 |
| Waste Plastics Sorting & Conditioning | 79 |
| Waste Plastics Recycling | 115 |
| Recycled Plastics Reprocessing | 45 |
| Reprocessed Plastics Manufacturing | 283 |
| Others (Stores, Admin, Accounts, Sales, Depots, HSE, etc.) | 140 |
| Total | 3,069 |